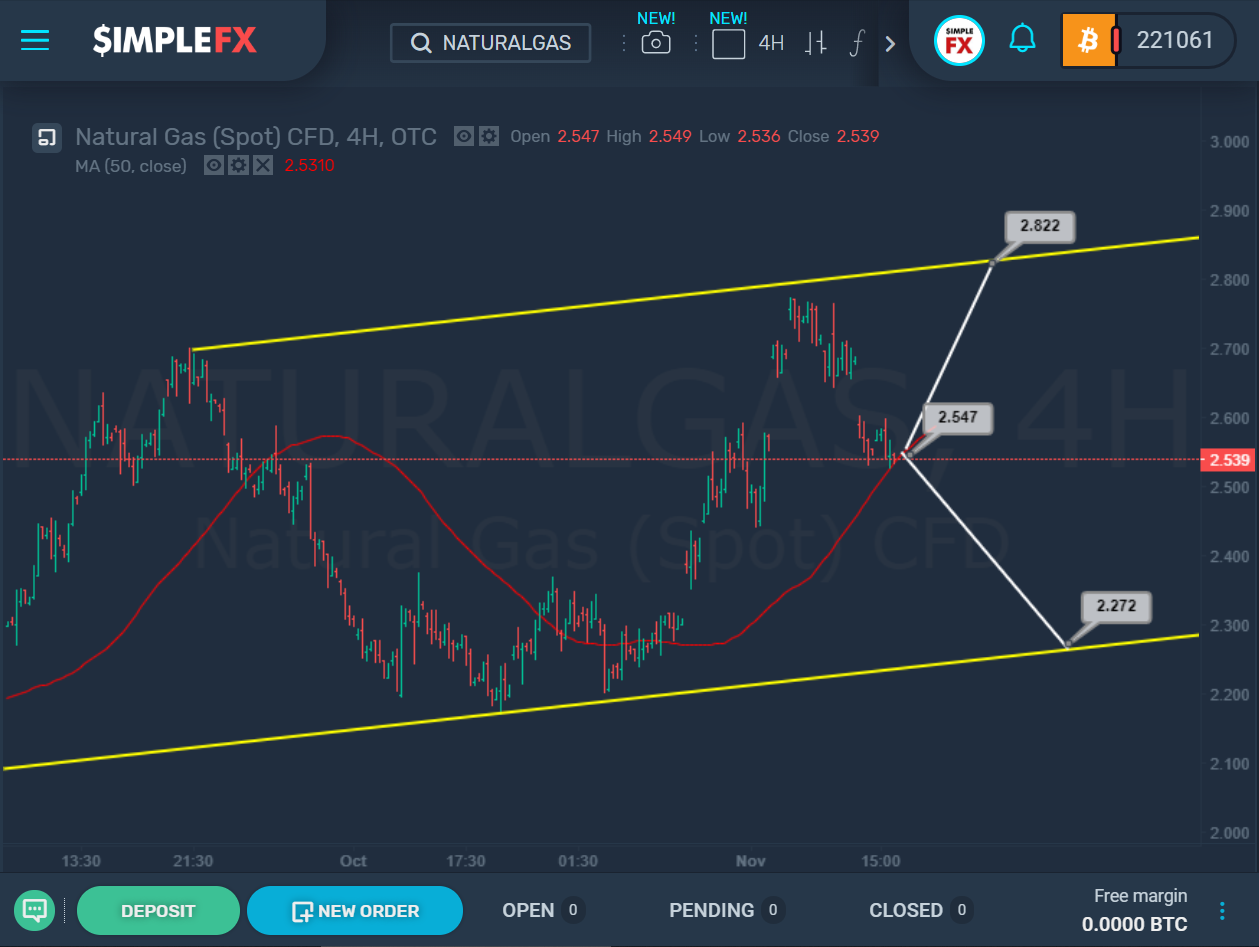
 The market is moving within the ascending yellow channel. During the previous trading weeks, we saw a price increase from the lower bound of this channel to its upper wall. Then, after rebounding from the upper bound, the price fell into the central zone of the yellow channel to the moving average, which is marked in red.
[button link=”https://app.basitfx.com/login” size=”medium” target=”new” text_color=”#eeeeee” color=”#df4444″]SELL NATURALGAS[/button] [button link=”https://app.basitfx.com/login” size=”medium” target=”new” text_color=”#eeeeee” color=”#3cc195″]BUY NATURALGAS[/button]
If in the near future we see a rebound from this line, and the price goes up from the level of 2.547, in this case, the bulls may have enough gas in the tank to reach the resistance level of 2.822, which is on the upper yellow wall.
However, if the moving average is broken below, the bears will open the way to the support level of 2.272, which is on the lower yellow border.

