It’s official. September 18, 2024, marks the beginning of a new cycle of monetary easing by the FOMC. 50bp – this is precisely the first cut we got yesterday.
So far, we have usually offered you a quick look at market reactions after a specific economic event. This cut is probably just the beginning of the entire cycle, which will have a massive impact on all markets. Therefore, before you, 3 decades of analysis. Here we go!
Understanding the Federal Reserve’s Decision
50 basis point cut marks the first one since the COVID-19 crisis, highlighting the Federal Reserve’s adaptive approach not only to the shifting economic landscape but also “a commitment to us not falling behind.” As the chairman emphasized, although employment in the US is currently near its maximum, there are visible signs of a slowdown.“Clearly, payroll job creation has moved down over the last few months,” he said. Still, Powell sees no reason to worry about the state of the economy right now, although historically, a reduction in this amount has heralded tough times. More on this later in the article.
Forward guidance
The so-called “dot plot” shows that all FOMC members, including both voting and non-voting participants, expect the benchmark federal funds rate to reach 4.4% by this year’s end, corresponding to a target range of 4.25% to 4.50%. The Fed has two more meetings scheduled for the year on November 6-7 and December 17-18.
The central bank projects interest rates to decrease to 3.4% by 2025, suggesting a full percentage point cut. By 2026, rates are expected to drop to 2.9%, reflecting an additional half-point reduction.
Key indicators to watch
So what influenced this decision, and which indicators should be monitored when predicting the Federal Reserve’s next moves?
- Employment Data: Recent and July’s Non-Farm Payrolls have shown a significant weakening of the labor market that the Fed could no longer tolerate to maintain the balance of prices and employment. NFP reports remain crucial to monitoring the strength of the U.S. economy. The next one is on October 4.
- Inflation Trends: The Consumer Price Index (CPI) recently reported a continuing disinflation trend, suggesting a controlled inflation environment that aligns more closely with the Fed’s target. Mark your calendar! The next reading will be on October 10.
- Economic Growth Indicators: The above indicators are not everything. It is also essential to monitor the statements of FOMC members as well as PPI or GDP readings.
Immediate market reactions and strategies
Historically, the beginning of the cycle is a period of increased investor activity and heightened volatility. Adapting investment strategies to accommodate the changing economic environment will be crucial. How did the market react in the first hours?
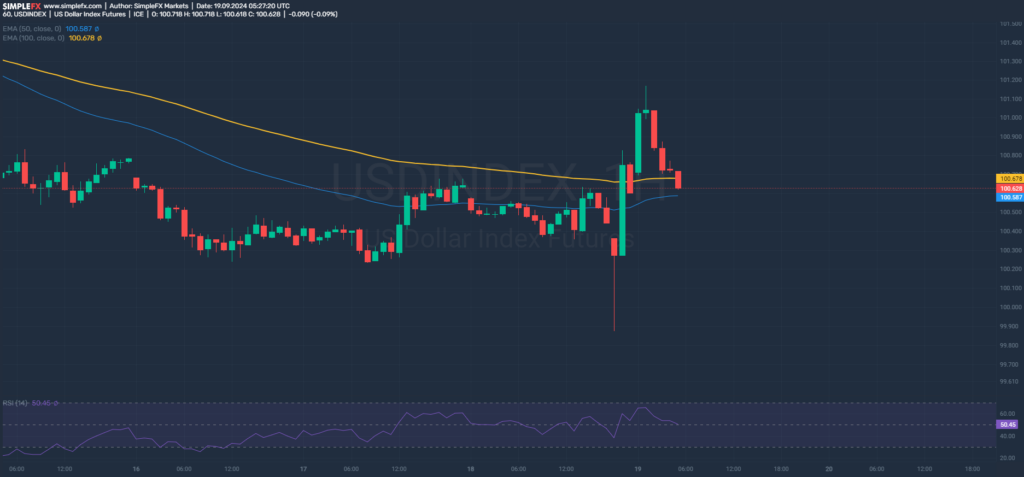
First rate cut: USD Index reaction.
As expected, the dollar weakened significantly against other major currencies. However, this reaction was met with a clear demand response, which can be seen in the long lower wick of the red candle. The subsequent appreciation was met with a reaction from the supply side, visible in the gravestone doji formation. Ultimately, the dollar index remains practically flat, which may indicate that the decision was adopted in a balanced manner.
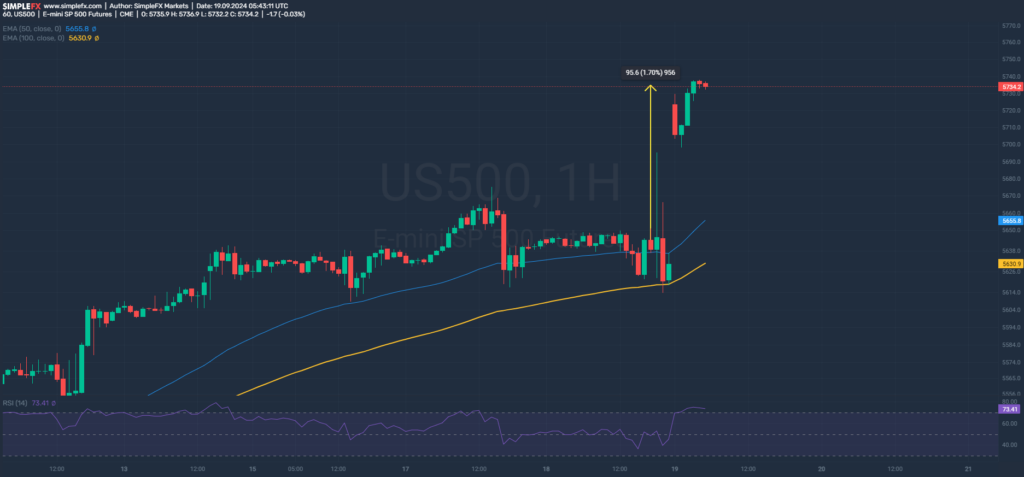
The S&P500 reaction: ATH.
What theoretically should satisfy investors is the reaction of perhaps the most important stock market benchmark in the world – the S&P500 index. It has grown by 1.7% since the rate decision, reaching an all-time high. Well, can this optimism be premature?
Navigating a brand new rate environment: The stock market
The impact of interest rate cuts on the stock market is ambiguous and undoubtedly cannot be reduced to one sequence: rate cuts = easier credit = higher company profits. That’s not so easy. The indices’ behavior results from the complex operation within the entire market, including the balance in internal and foreign trade, the level of employment, investments, sales, their projection, and so on.
Historically, there are at least two examples in which markets reacted completely differently after a rate cut.
So let’s go back 30 years.
1990s
The last decade of the last millennium was definitely a joyous time for the stock market. But let’s add some background.
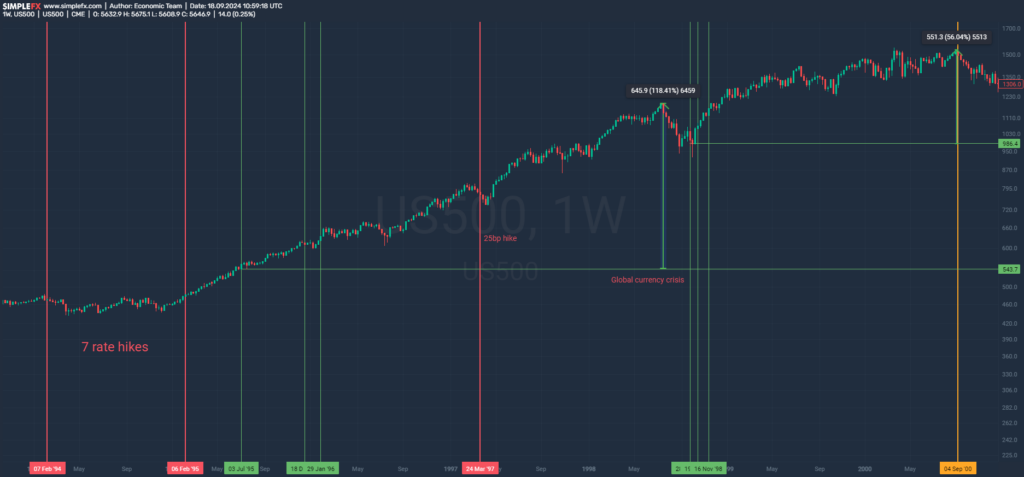
The S&P500 during the 90s interest rate cycle.
It’s the mid-1990s, and the Fed is achieving what no permabear would ever believe in – the so-called soft landing. Alan Greenspan, the current head of the Fed, began the cycle of rate increases in February 1994 and did so a total of 7 times until February 1995. The Federal Funds Rate increased from 3.25% to 6.00%. During this operation, the index return remained flat. It should be added here that in the years 1992 – 1994, the American economy recorded GDP growth at the level of 3.5%, 2.8%, and, note, 4%, respectively.
Rate adjustments occurred thrice between July 1995 and January 1996, with the Federal Funds Rate dropping to 5.25%. As it turned out, from the first reduction until the outbreak of the Global Currency Crisis in 1998, the S&P500 index grew by almost 120% in 4 years. It is worth noting that the ‘97 increase marked in red was a cosmetic move by the Fed in the face of inflation risks related to the boom of the 1990s.
Thailand. It was the country in which the Asian currency crisis began in 1997, then spread to Russia in 1998, and resulted in the collapse of the highly leveraged LTCM fund in the same year. The Fed, forced to react, reduced interest rates thrice between September 1998 and November 1998, bringing them down to 4.75%.
What happened next?
The bull market continued. The S&P 500 Index rose another 56% in two years until the peak of the dot-com bubble in September 2000.
2000s
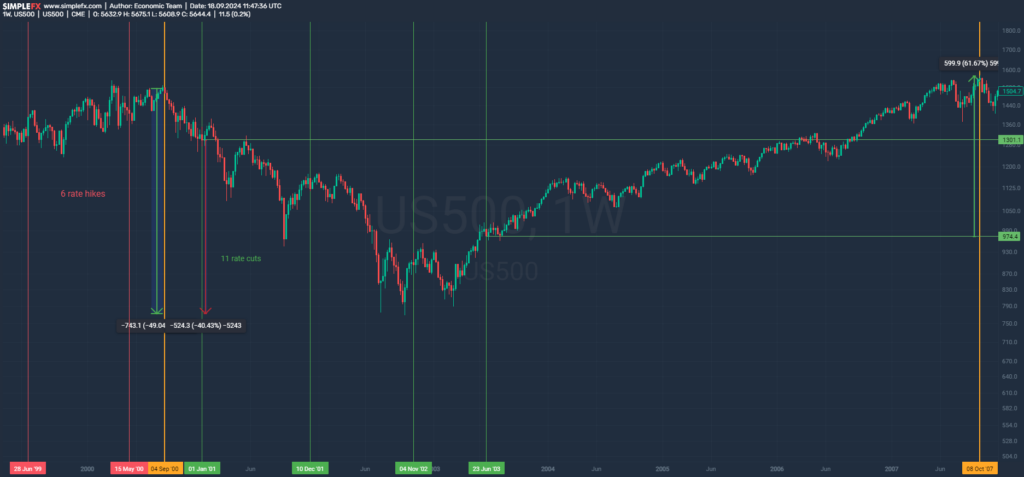
The very end of the 1990s no longer meant the mythical FED soft landing. Alan Greenspan, still the institution’s president, did not want inflation expectations to anchor above expectations; therefore, the FOMC began a monetary tightening.
The S&P500 during the 00s interest rate cycle.
It lasted from June 1999 to May 2000. The cycle included 6 hikes, which increased the Federal Funds Rate from 5.00% to 6.50%. Just a quarter later, the S&P500 index reached its peak. Interestingly, after the last hike, we even experienced rally relief, which turned out to be a false hope in the long term. The bubble burst, and the index lost half its value in 2 years.
At this point, however, we are more interested in the cycle of reductions – the easing of monetary policy.
This time, unlike in the 1990s, the first lowering of the rate did not help stock prices—and neither did the remaining 10 cuts! It should be added that as many as 8 of them, including the first one, were 50bp. But that wasn’t the end. The dot-com recession lasted from March to November 2001, and the Fed, concerned about the anemic growth, added two more rate cuts. One in November ’02 and the other in June ’03. The cycle of reductions ended with the Federal Funds Rate of 1.00%
To put it briefly, after the first reduction in the cycle in January 2001, the S&P500 index fell by 40% in 1.5 years. Only after the last reduction did it start to grow, and in just over 4 years, increased by 61%.
The GFC cuts
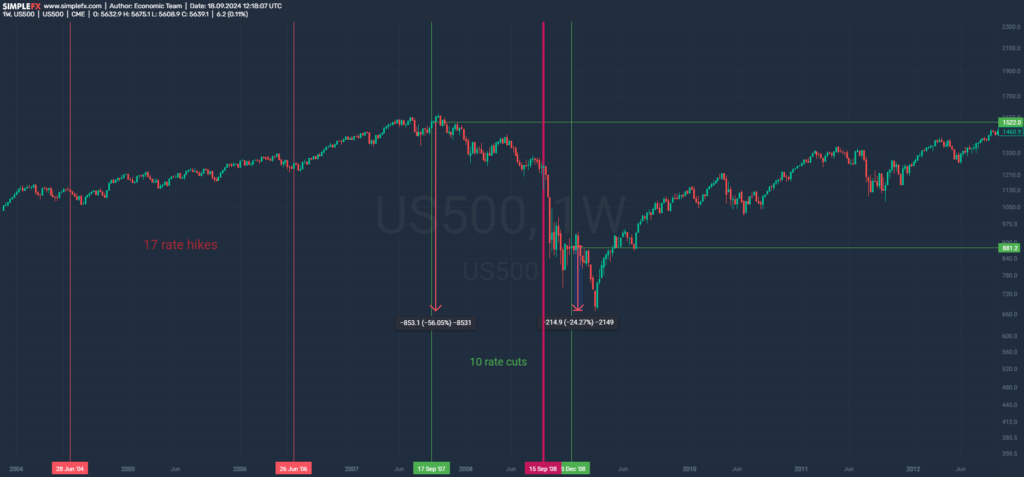
The 2004-2006 tightening cycle included as many as 17 increases of 25bp each, bringing the Federal Funds Rate to 5.25%.
The S&P500 during the GFC.
The Fed was trying to cool the economy and the real estate bubble it had helped create through half a decade of loose monetary policy. As conditions tightened, the S&P 500 rose, peaking in October 2007.
As a result of such a significant rate increase, unemployment grew very quickly at the beginning of 2007. Hence, just over a year after the last increase, the FOMC began to lower rates again. This was to promote economic growth and increase liquidity in the market. The cycle included 10 reductions from September 2007 to December 2008, and the Federal Funds Rate dropped to the 0.00% – 0.25% range.
Again, the first cut was 50 bp, occurring almost precisely at the index’s ATH. Just like now. We don’t know what the future holds, but we know further events in the fall of 2007.
The S&P500 fell by over 56% in just 1.5 years. It is worth adding here that the declines accelerated after the credit crunch resulting from the collapse of Lehmann Brothers in September 2008. Moreover, even after the last rate cut in December 2008 (100bp!), the index fell by an additional 24%.
2009 – 2024
March 2009 marked a local low, after which the S&P500 grew similarly to the 1990s decade. In almost 11 years, it increased by over 400%.
The S&P500 during the 10s – 20s interest rate cycle.
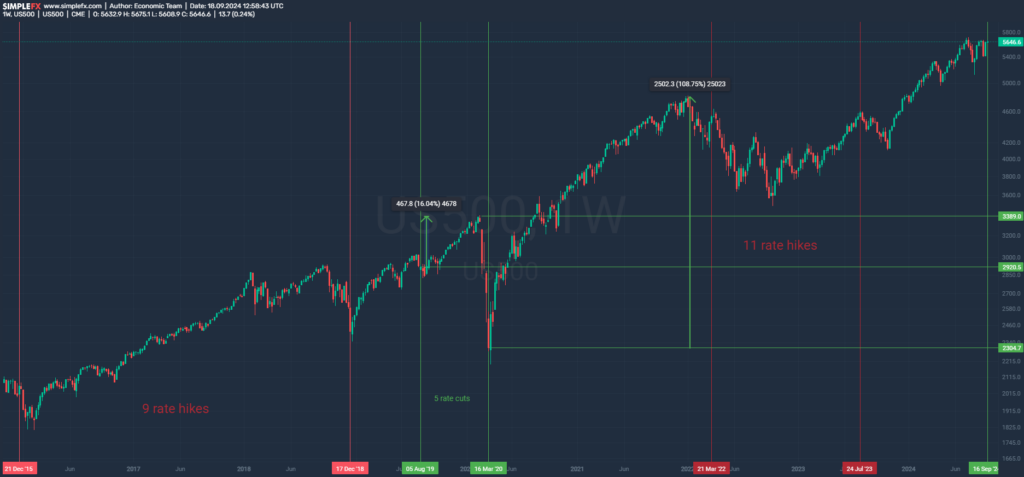
The Fed kept rates near 0 for about 7 years. The cycle of increases began at the end of 2015 and ended in 2018. During this time, the index recorded increases. The cycle of reductions began in August 2019 in what Chairman Jerome Powell called the Mid-Cycle Adjustment. The Fed was easing rates midway through the typical expansion-to-recession business cycle. Inflation allowed this.
We are naturally interested in the index’s behavior after the first reduction, which amounted to 25 bp and allowed the S&P500 to grow by another 16% for 7 months until the collapse caused by the outbreak of COVID-19. Since the last reduction (again by 100bp) in March 2020, the index has grown by over 100% by the end of 2021.
Conclusion
The Federal Reserve’s decision to cut interest rates by 50 basis points seems to give us a specific signal. Historically, the valuation of the S&P500 index after the first reduction increased (the 1990s) and decreased (dot-com bubble, GFC). Therefore, how the market will behave is going to depend on many factors determining economic development, with particular emphasis on whether we are currently in a recession or whether it’s around the corner. Essential are also conditions of the labor market, companies’ incomes, sales levels, and the occurrence of local bubbles. The situation should now be closely monitored, regardless of the investment horizon.
The information provided on this website does not, and is not intended to, constitute investment advice; all information, content, and materials available on this site are for general informational purposes only.

